Geraldine Lee
Published: Feb 26, 2026 | Updated: Feb 25, 2026

Your gates are open. Guests are coming through. The team is in motion. But here's the question most operators don't ask until it's too late: do you actually know how it's going?
Most attraction operators don't look at their data until the season is over. By then, it's a postmortem — interesting, maybe even useful for next year, but too late to change anything about the season that just ended.
The operators who finish strongest are the ones who start tracking from day one. Not with complex analytics projects or consultants — just with five core reports, reviewed weekly, that give you the clarity to make real adjustments while there's still time.
Here are the five reports to set up in your first week.
Break down your ticket and booking revenue by source — online direct (your website), POS (walk-ups and on-site sales), OTAs (Viator, GetYourGuide, Expedia), and reseller/concierge channels.
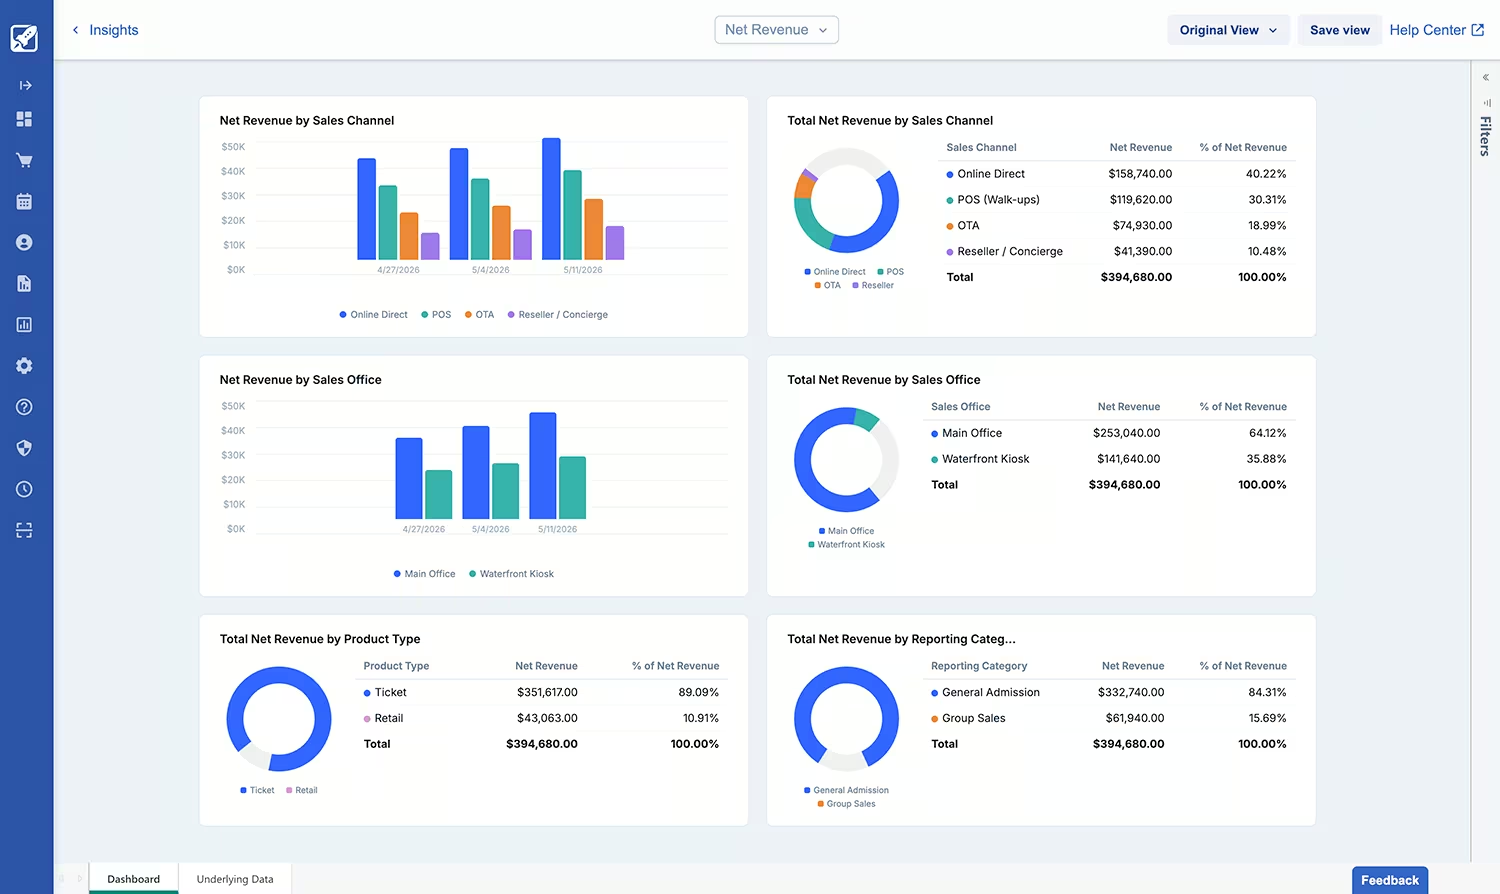
Your channel mix tells you where your guests are actually coming from — and whether that balance is healthy. If OTA revenue is growing faster than direct sales, you may be paying more in commissions than you need to. If online direct is flat despite increased marketing spend, something in your booking funnel isn't converting.
Compare your current channel split to the same period last year. If online direct hasn't grown, revisit your web engine and booking flow. If OTAs are dominating, think about how to shift that balance toward direct channels where your margins are better.
With real-time dashboards, you can see this data as it comes in rather than waiting for a monthly reconciliation.
Total bookings over time, broken down by product type (tickets, retail, memberships, gift cards, prepaid passes) and by sales channel (online, POS, OTAs, resellers).
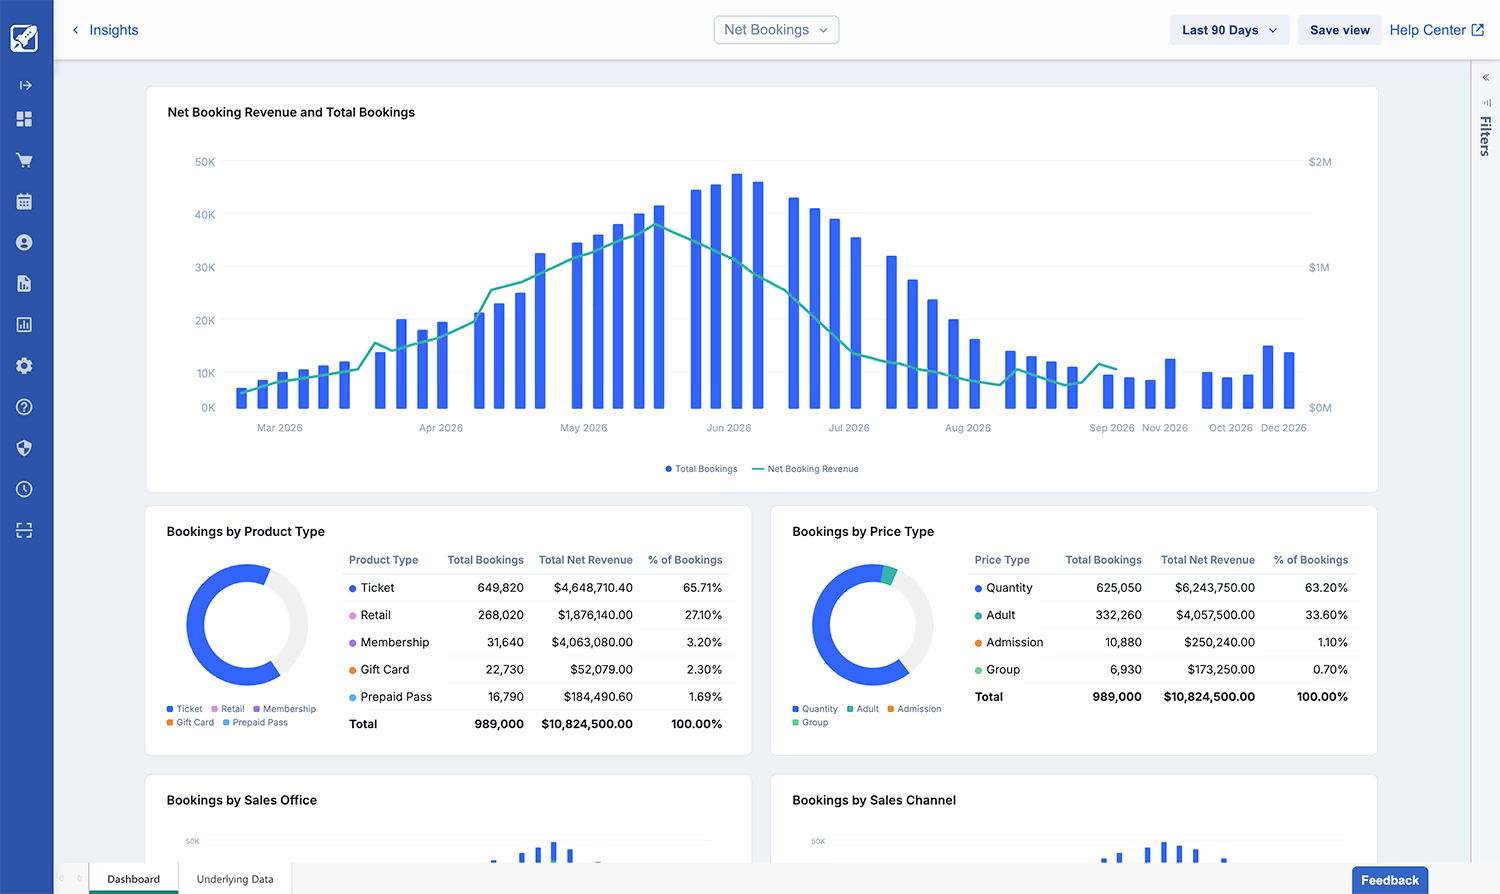
Revenue by channel (Report #1) tells you where your money is coming from. Booking pace tells you whether enough people are actually buying — and what they're buying.
If your total bookings are trending below the same week last year, that's an early warning. If ticket bookings are strong but retail and membership bookings are flat, you're leaving ancillary revenue on the table.
The product mix breakdown is especially revealing.
These patterns tell you where to focus your energy while the season is still young.
Pull up your Net Bookings dashboard and look at two things.
First, your booking trend line: is volume building week over week the way you'd expect for this point in the season? If it's flat or declining, revisit your web engine and booking flow — a conversion issue caught in week one is worth far more than one caught in week ten.
Second, check your product type split. If tickets dominate but retail and membership bookings are barely registering, that's a signal to revisit how those products are surfaced during checkout and on-site.
This is also where you'll see the payoff from your preseason work on abandoned cart recovery and automated guest messaging.
If those systems are running, your booking pace should reflect it. If they're not — set them up now, while every day of the season still counts.
Which promo codes are being redeemed? Which email campaigns or ads actually drove bookings? Which promotions generated excitement but no measurable return?
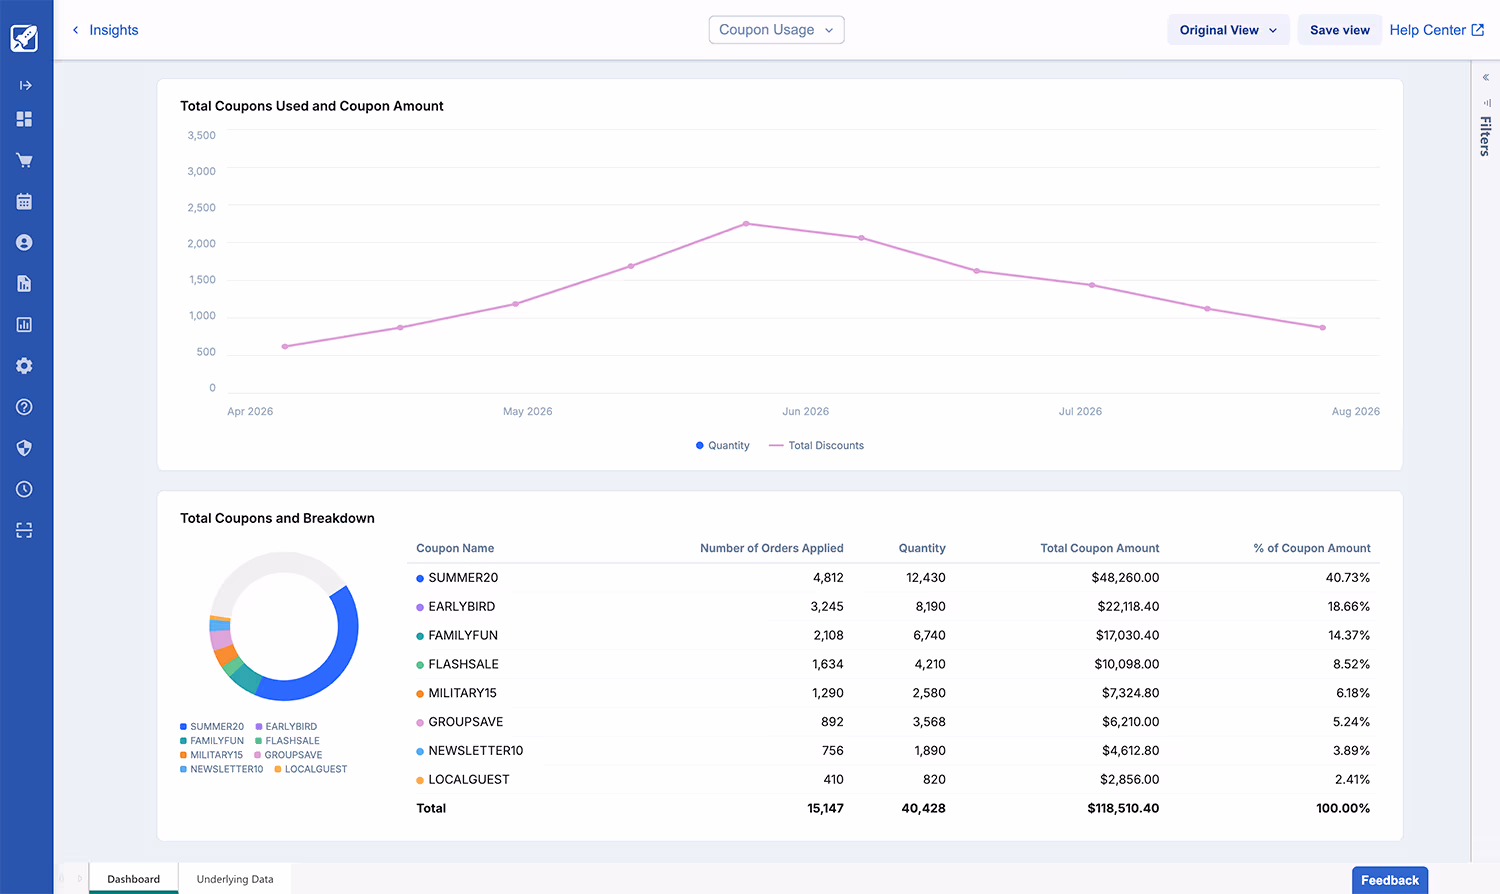
Your marketing budget is finite. Every dollar spent on a promotion that doesn't drive incremental revenue is a dollar that could have been spent elsewhere. But most operators don't track promotion performance with enough granularity to know what's working.
Make sure every active promotion has a unique tracking code. Set up a weekly review of redemption volume, discount cost, and incremental revenue generated.
The goal isn't to stop running promotions — it's to double down on the ones that actually work.
Daily and weekly attendance compared to the same period last year.
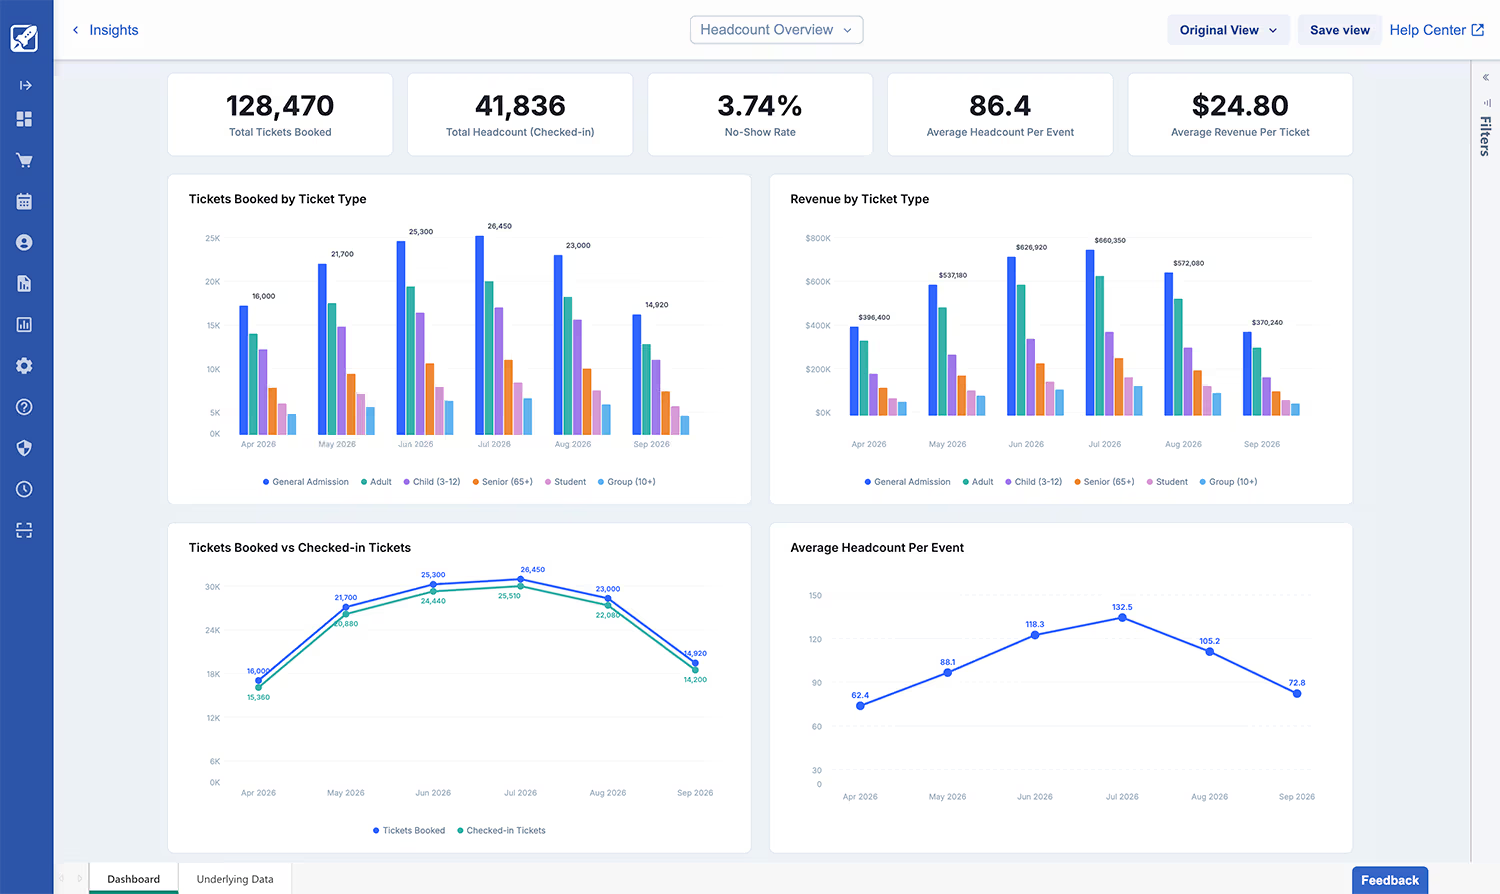
This is your pace check. Are you ahead, behind, or on track? More importantly, if you're behind, understanding why helps you respond correctly. If attendance is down, there are three common diagnoses:
Each diagnosis leads to a very different action. Without the data, you're guessing.
Set up a year-over-year attendance comparison dashboard. Review it every Monday morning. When you see a dip, diagnose it immediately rather than waiting weeks to investigate.
How many new members are you signing up per week? What's the conversion rate from single-visit guest to member or season pass holder?
Peak traffic is your biggest membership conversion window. The guests walking through your gates right now are having the experience — and that's the best moment to ask them to commit to coming back.
If you're not actively tracking and pushing membership acquisition during your busiest weeks, you're missing your largest opportunity.
Set a weekly membership acquisition target. Train your frontline staff on the membership pitch — keep it simple and benefits-focused. Place signage at entry, exits, and high-traffic areas. And set up a post-visit email to non-members that makes a clear, compelling case for joining: "You visited this week. Here's what you'd get as a member."
Use automated renewal reminders for existing members to keep retention rates high without manual follow-up.
These five reports don't require a data science team. They require about 30 minutes once a week — ideally Monday morning before the week gets busy.
Pull the numbers. Spot the trends. Make one or two adjustments. Then get back to running your operation.
That 30-minute habit is the difference between operators who react to their season and operators who shape it. Don't wait for the postmortem. Start now.
To learn more about how RocketRez Insights can help you track and act on these metrics in real time, book a demo with our team.